Spectral Topography of the Subthalamic Nucleus to Inform Next-Generation Deep Brain Stimulation.
In patients with Parkinson’s receiving deep brain stimulation (DBS) therapy, the precise locations of different types of electrical activity in the targeted brain region, the subthalamic nucleus, were unknown. In this study, we present a map of electrical signals at various frequencies in this key brain region. Some of these signals could be used to enhance the accuracy of DBS treatments, leading to better outcomes for patients.
The landscape of neurophysiological symptoms and behavioral biomarkers in basal ganglia signals for movement disorders is expanding. The clinical translation of sensing-based deep brain stimulation (DBS) also requires a thorough understanding of the anatomical organization of spectral biomarkers within the subthalamic nucleus (STN).
The aims were to systematically investigate the spectral topography, including a wide range of sub-bands in STN local field potentials (LFP) of Parkinson's disease (PD) patients, and to evaluate its predictive performance for clinical response to DBS.
STN-LFPs were recorded from 70 PD patients (130 hemispheres) awake and at rest using multicontact DBS electrodes. A comprehensive spatial characterization, including hot spot localization and focality estimation, was performed for multiple sub-bands (delta, theta, alpha, low-beta, high-beta, low-gamma, high-gamma, and fast-gamma (FG) as well as low- and fast high-frequency oscillations [HFO]) and compared to the clinical hot spot for rigidity response to DBS. A spectral biomarker map was established and used to predict the clinical response to DBS.
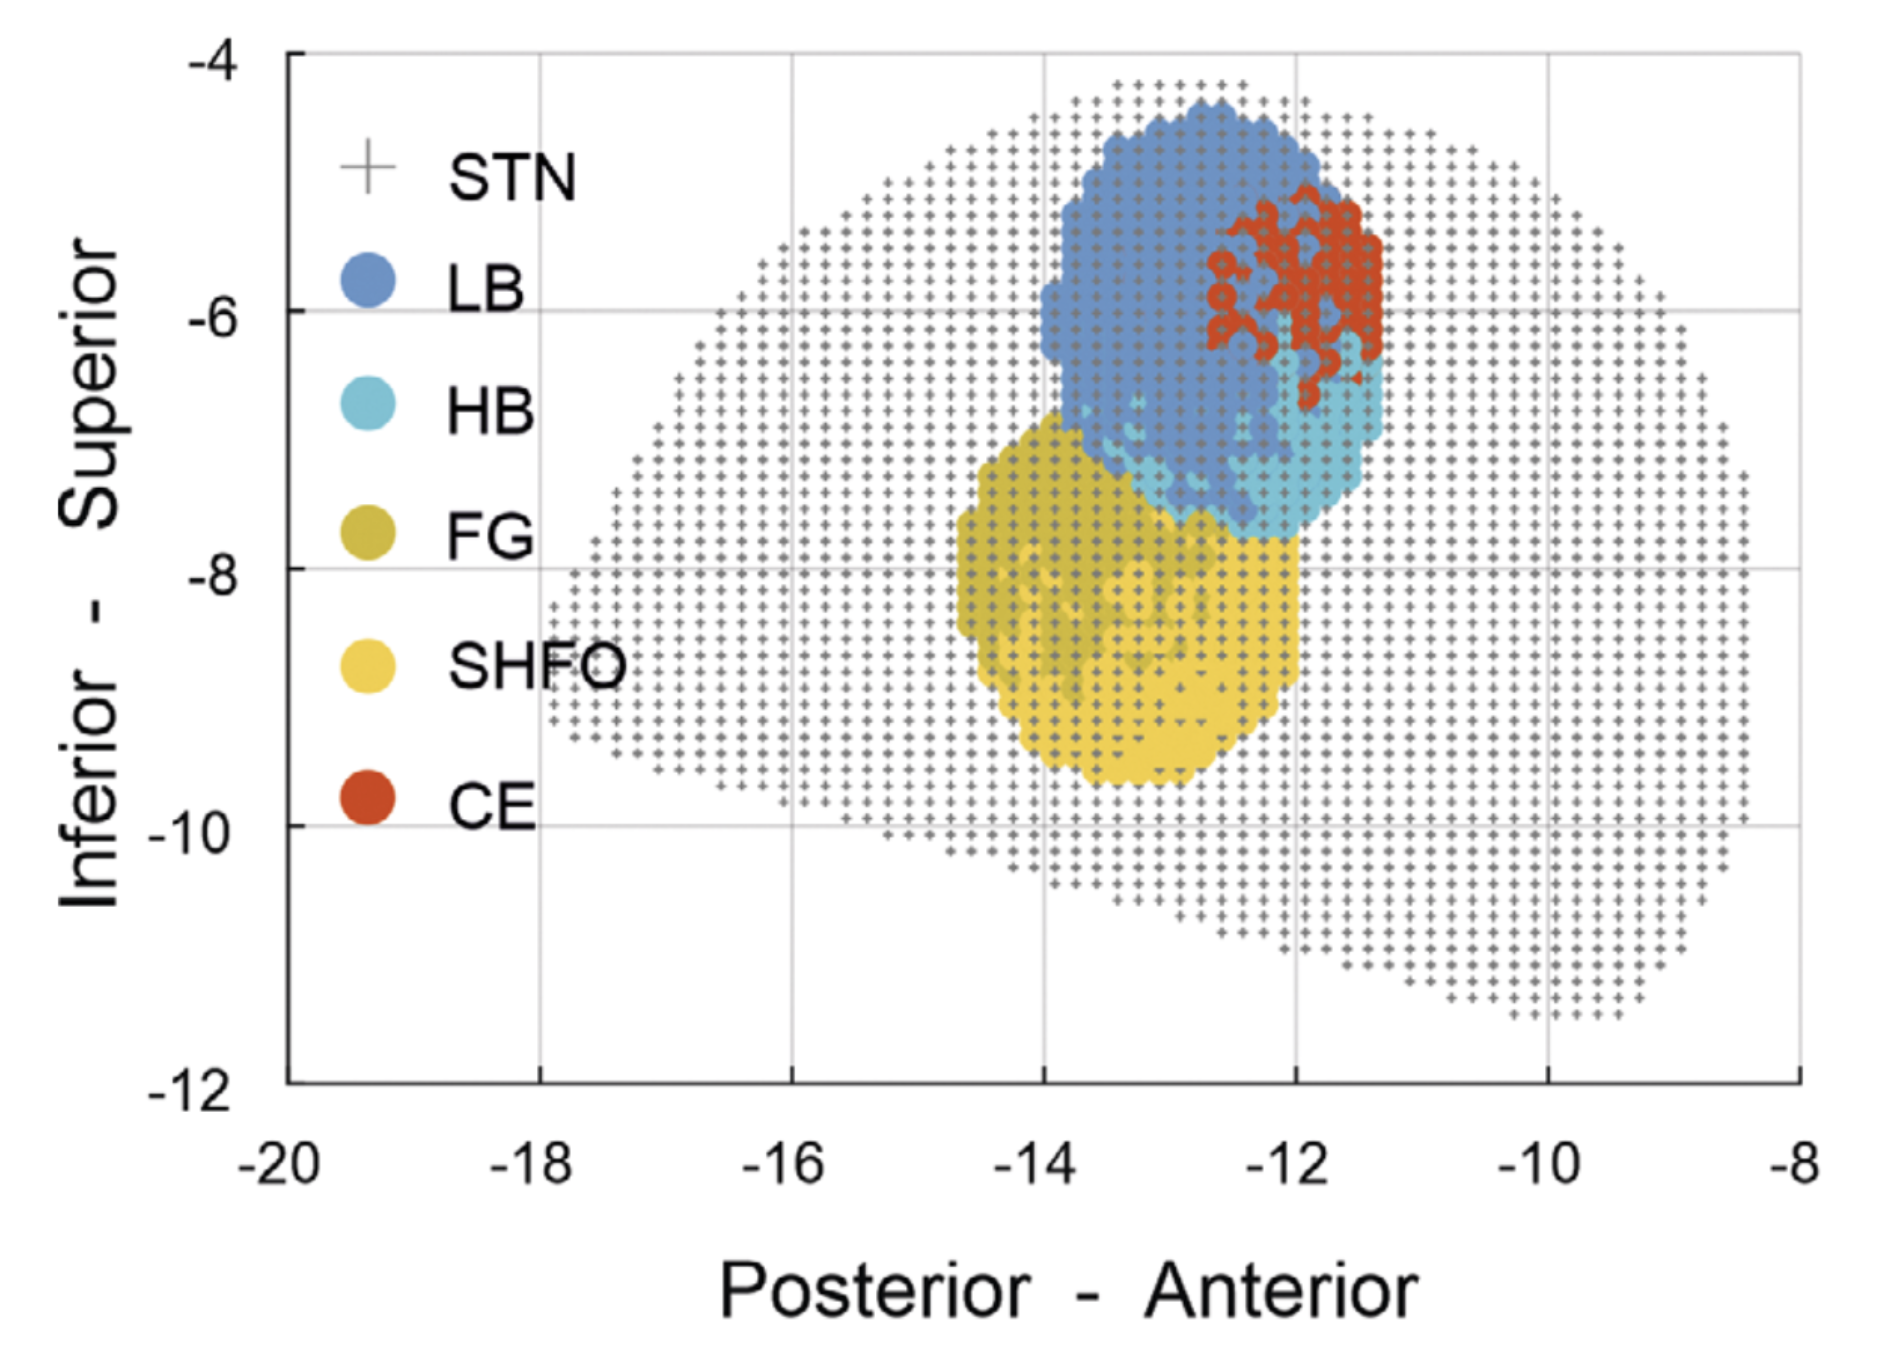
The STN shows a heterogeneous topographic distribution of different spectral biomarkers, with the strongest segregation in the inferior-superior axis. Relative to the superiorly localized beta hot spot, HFOs (FG, slow HFO) were localized up to 2 mm more inferiorly. Beta oscillations are spatially more spread compared to other sub-bands. Both the spatial proximity of contacts to the beta hot spot and the distance to higher-frequency hot spots were predictive for the best rigidity response to DBS.
The spatial segregation and properties of spectral biomarkers within the DBS target structure can additionally be informative for the implementation of next-generation sensing-based DBS. © 2023 The Authors. Movement Disorders published by Wiley Periodicals LLC on behalf of International Parkinson and Movement Disorder Society.
2023. Mov Disord, 38(5):818-830.
2023. Brain, 146(12):5015-5030.
2023. Neuromodulation, 26(2):320-332.
2023. PLoS Biol, 21(6)e3002140.